Analytics · Paid Media
ROAS Benchmarks by Industry: What "Good" Actually Looks Like
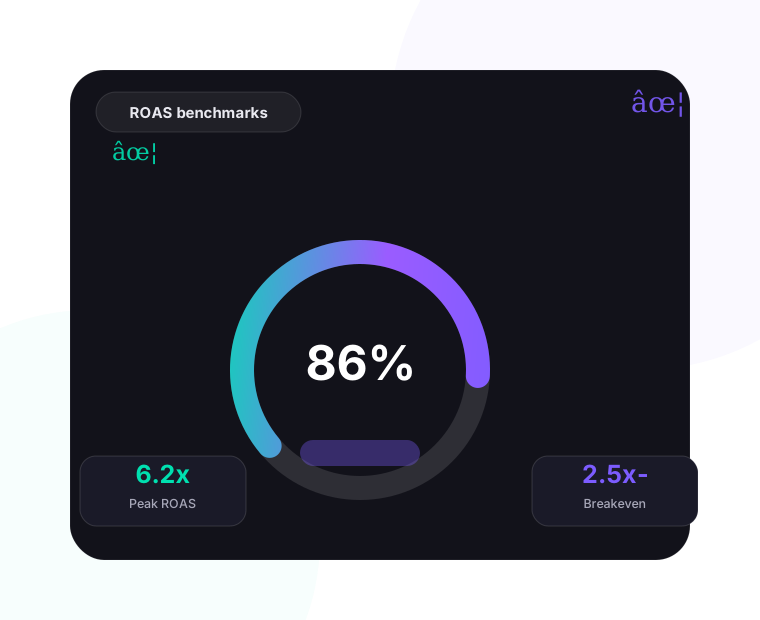
The single biggest mistake in paid media is comparing your ROAS to a number someone else posted. Your "good" depends on margin, order value and whether you're measuring blended or incremental return.
Why a flat benchmark lies
A 2× ROAS is fantastic for a 70% margin business and a disaster for a 15% margin one. Before judging your ads, know your breakeven ROAS — then add your target profit on top.
Ranges that actually hold up
- E-commerce (high margin, >50%) — blended ROAS of 3.5–5× is healthy; scale 2.5×+.
- E-commerce (low margin, <25%) — 5–7× blended is the realistic bar.
- B2B SaaS — judge by CAC payback and LTV:CAC (3:1+), not raw ROAS.
- Lead gen / B2B services — cost per qualified lead beats ROAS as a north star.
- DTC / paid social — top-of-funnel blends lower; retargeting blends 5–10×.
The one metric that matters more
Incrementality. If a channel would have converted anyway, its ROAS is an illusion. Ask whether you're measuring attribution, not just return.
Benchmark against your own unit economics first. Industry averages are a floor, not a target.
Wondering what your accounts are actually returning? Let w3logics run an analytics review and a PPC audit to find out.
Get a straight answer on your ROAS.
Book a free strategy call and we'll benchmark your accounts against your real margins.